You might be familiar with Linux load averages already. Load averages are the three numbers shown with the uptime and top commands – they look like this:
load average: 0.09, 0.05, 0.01
Most people have an inkling of what the load averages mean: the three numbers represent averages over progressively longer periods of time (one, five, and fifteen-minute averages), and that lower numbers are better. Higher numbers represent a problem or an overloaded machine. But, what’s the threshold? What constitutes “good” and “bad” load average values? When should you be concerned over a load average value, and when should you scramble to fix it ASAP?
First, a little background on what the load average values mean. We’ll start out with the simplest case: a machine with one single-core processor.
The traffic analogy
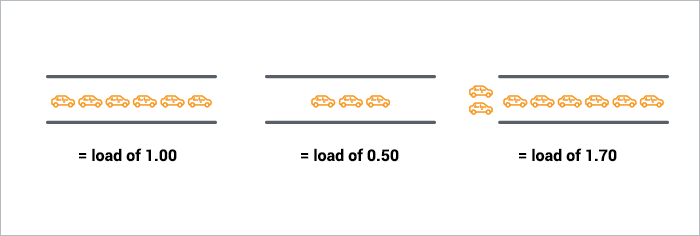
A single-core CPU is like a single lane of traffic. Imagine you are a bridge operator … sometimes your bridge is so busy there are cars lined up to cross. You want to let folks know how traffic is moving on your bridge. A decent metric would be how many cars are waiting at a particular time. If no cars are waiting, incoming drivers know they can drive across right away. If cars are backed up, drivers know they’re in for delays.
So, Bridge Operator, what numbering system are you going to use? How about:
0.00 means there’s no traffic on the bridge at all. In fact, between 0.00 and 1.00 means there’s no backup, and an arriving car will just go right on.
1.00 means the bridge is exactly at capacity. All is still good, but if traffic gets a little heavier, things are going to slow down.
over 1.00 means there’s backup. How much? Well, 2.00 means that there are two lanes worth of cars total — one lane’s worth on the bridge, and one lane’s worth waiting. 3.00 means there are three lanes worth total — one lane’s worth on the bridge, and two lanes’ worth waiting. Etc.
This is basically what CPU load is. “Cars” are processes using a slice of CPU time (“crossing the bridge”) or queued up to use the CPU. Unix refers to this as the run-queue length: the sum of the number of processes that are currently running plus the number that are waiting (queued) to run.
Like the bridge operator, you’d like your cars/processes to never be waiting. So, your CPU load should ideally stay below 1.00. Also, like the bridge operator, you are still ok if you get some temporary spikes above 1.00 … but when you’re consistently above 1.00, you need to worry.
So you’re saying the ideal load is 1.00?
Well, not exactly. The problem with a load of 1.00 is that you have no headroom. In practice, many sysadmins will draw a line at 0.70:
The “Need to Look into it” Rule of Thumb: 0.70 If your load average is staying above > 0.70, it’s time to investigate before things get worse.
The “Fix this now” Rule of Thumb: 1.00. If your load average stays above 1.00, find the problem and fix it now. Otherwise, you’re going to get woken up in the middle of the night, and it’s not going to be fun.
The “Arrgh, it’s 3 AM WTF?” Rule of Thumb: 5.0. If your load average is above 5.00, you could be in serious trouble, your box is either hanging or slowing way down, and this will (inexplicably) happen in the worst possible time like in the middle of the night or when you’re presenting at a conference. Don’t let it get there.
What about Multi-processors? My load says 3.00, but things are running fine!
Got a quad-processor system? It’s still healthy with a load of 3.00.
On a multi-processor system, the load is relative to the number of processor cores available. The “100% utilization” mark is 1.00 on a single-core system, 2.00, on a dual-core, 4.00 on a quad-core, etc.
If we go back to the bridge analogy, the “1.00” really means “one lane’s worth of traffic”. On a one-lane bridge, that means it’s filled up. On a two-lane bridge, a load of 1.00 means it’s at 50% capacity — only one lane is full, so there’s another whole lane that can be filled.
Same with CPUs: a load of 1.00 is 100% CPU utilization on a single-core box. On a dual-core box, a load of 2.00 is 100% CPU utilization.
Multicore vs. multiprocessor
While we’re on the topic, let’s talk about multicore vs. multiprocessor. For performance purposes, is a machine with a single dual-core processor basically equivalent to a machine with two processors with one core each? Yes. Roughly. There are lots of subtleties here concerning amount of cache, frequency of process hand-offs between processors, etc. Despite those finer points, for the purposes of sizing up the CPU load value, the total number of cores is what matters, regardless of how many physical processors those cores are spread across.
Which leads us to two new Rules of Thumb:
The “number of cores = max load” Rule of Thumb: on a multicore system, your load should not exceed the number of cores available.
The “cores is cores” Rule of Thumb: How the cores are spread out over CPUs doesn’t matter. Two quad-cores == four dual-cores == eight single-cores. It’s all eight cores for these purposes.
Bringing It Home
Let’s take a look at the load averages output from uptime:
This is on a dual-core CPU, so we’ve got lots of headroom. I won’t even think about it until load gets and stays above 1.7 or so.
Now, what about those three numbers? 0.65 is the average over the last minute, 0.42 is the average over the last five minutes, and 0.36 is the average over the last 15 minutes. Which brings us to the question:
Which average should I be observing? One, five, or 15 minutes?
For the numbers we’ve talked about (1.00 = fix it now, etc), you should be looking at the five or 15-minute averages. Frankly, if your box spikes above 1.0 on the one-minute average, you’re still fine. It’s when the 15-minute average goes north of 1.0 and stays there that you need to snap to. (obviously, as we’ve learned, adjust these numbers to the number of processor cores your system has).
So # of cores is important to interpreting load averages … how do I know how many cores my system has?
cat /proc/cpuinfo to get info on each processor in your system. Note: not available on OSX, Google for alternatives. To get just a count, run it through grep and word count: grep 'model name' /proc/cpuinfo | wc -l
More servers? Or faster code?
Adding servers can be a band-aid for slow code. Scout APM helps you find and fix your inefficient and costly code. We automatically identify N+1 SQL calls, memory bloat, and other code-related issues so you can spend less time debugging and more time programming.
-> ) CHARSET=ascii ROW_FORMAT=Compact;
ERROR 1118 (42000): Row size too large. The maximum row size for the used table type, not counting BLOBs, is 65535. This includes storage overhead, check the manual. You have to change som mysql>
如果你了解 ES 应该知道,ES 可以说是对 Lucene 的一个封装,里面关于倒排索引的实现就是通过 lucene 这个 jar 包提供的 API 实现的,所以下面讲的关于倒排索引的内容实际上都是 lucene 里面的内容。
三、倒排索引
首先我们还不能忘了我们之前提的搜索需求,先看下建立倒排索引之后,我们上述的查询需求会变成什么样子,
这样我们一输入“前”,借助倒排索引就可以直接定位到符合查询条件的古诗。
当然这只是一个很大白话的形式来描述倒排索引的简要工作原理。在 ES 中,这个倒排索引是具体是个什么样的,怎么存储的等等,这些才是倒排索引的精华内容。
1. 几个概念
在进入下文之前,先描述几个前置概念。
term
关键词这个东西是我自己的讲法,在 ES 中,关键词被称为 term。
postings list
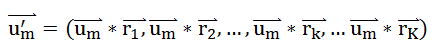
还是用上面的例子,{静夜思, 望庐山瀑布}是 “前” 这个 term 所对应列表。在 ES 中,这些被描述为所有包含特定 term 文档的 id 的集合。由于整型数字 integer 可以被高效压缩的特质,integer 是最适合放在 postings list 作为文档的唯一标识的,ES 会对这些存入的文档进行处理,转化成一个唯一的整型 id。
于是乎就有了 term dictionary,ES 为了能快速查找到 term,将所有的 term 排了一个序,二分法查找。是不是感觉有点眼熟,这不就是 MySQL 的索引方式的,直接用 B+树建立索引词典指向被索引的数据。
term index
但是问题又来了,你觉得 Term Dictionary 应该放在哪里?肯定是放在内存里面吧?磁盘 io 那么慢。就像 MySQL 索引就是存在内存里面了。
但是如果把整个 term dictionary 放在内存里面会有什么后果呢?
内存爆了…
别忘了,ES 默认可是会对全部 text 字段进行索引,必然会消耗巨大的内存,为此 ES 针对索引进行了深度的优化。在保证执行效率的同时,尽量缩减内存空间的占用。
于是乎就有了 term index。
Term index 从数据结构上分类算是一个“Trie 树”,也就是我们常说的字典树。这是一种专门处理字符串匹配的数据结构,用来解决在一组字符串集合中快速查找某个字符串的问题。
这棵树不会包含所有的 term,它包含的是 term 的一些前缀(这也是字典树的使用场景,公共前缀)。通过 term index 可以快速地定位到 term dictionary 的某个 offset,然后从这个位置再往后顺序查找。就想右边这个图所表示的。(怎么样,像不像我们查英文字典,我们定位 S 开头的第一个单词,或者定位到 Sh 开头的第一个单词,然后再往后顺序查询)
lucene 在这里还做了两点优化,一是 term dictionary 在磁盘上面是分 block 保存的,一个 block 内部利用公共前缀压缩,比如都是 Ab 开头的单词就可以把 Ab 省去。二是 term index 在内存中是以 FST(finite state transducers)的数据结构保存的。
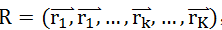
对于如何压缩,可能会有人觉得没有必要,”posting list 不是已经只存储文档 id 了吗?还需要压缩?”,但是如果在 posting list 有百万个 doc id 的情况,压缩就显得很有必要了。(比如按照朝代查询古诗?),至于为啥需要求交并集,ES 是专门用来搜索的,肯定会有很多联合查询的需求吧 (AND、OR)。
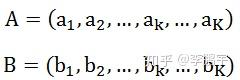
比如现在有 id 列表 [73, 300, 302, 332, 343, 372],转化成每一个 id 相对于前一个 id 的增量值(第一个 id 的前一个 id 默认是 0,增量就是它自己)列表是[73, 227, 2, 30, 11, 29]。在这个新的列表里面,所有的 id 都是小于 255 的,所以每个 id 只需要一个字节存储。